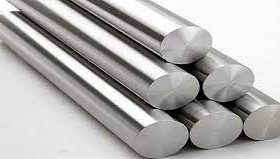
Detailed prices of gold, palladium, platinum and silver futures in the world ended the trading session on December 15, 2021.
Price list of precious metals today 16/12:
Gold (USD/ounce)
| Period | Openingprice | Expensive | Lowprice | Latesprice | Price of the previous day |
| Dec’21 | 1767,4 | 1778,7 | 1753,9 | 1762,6 | 1770,4 |
| Jan’22 | 1778,3 | 1781,2 | 1775,0 | 1780,5 | 1763,6 |
| Feb’22 | 1777,9 | 1782,2 | 1775,7 | 1781,2 | 1764,5 |
| Apr’22 | 1781,2 | 1784,4 | 1778,4 | 1783,5 | 1766,9 |
| Jun’22 | 1786,2 | 1786,2 | 1780,9 | 1785,0 | 1769,0 |
| Aug’22 | 1775,4 | 1785,2 | 1764,1 | 1771,5 | 1779,3 |
| Oct’22 | 1781,4 | 1787,0 | 1763,8 | 1773,6 | 1781,3 |
| Dec’22 | 1793,0 | 1793,0 | 1792,9 | 1792,9 | 1783,9 |
| Feb’23 | 1784,1 | 1784,1 | 1779,0 | 1779,0 | 1786,8 |
| Apr’23 | 1782,0 | 1782,0 | 1782,0 | 1782,0 | 1789,8 |
| Jun’23 | 1785,2 | 1785,2 | 1785,2 | 1785,2 | 1793,0 |
Palladium (USD/ounce)
| Period | Openingprice | Expensive | Lowprice | Latest price | Price of the previous day |
| Dec’21 | 1549,40 | 1549,40 | 1549,40 | 1549,40 | 1620,50 |
| Jan’22 | 1550,00 | 1550,00 | 1550,00 | 1550,00 | 1621,10 |
| Feb’22 | 1611,50 | 1611,50 | 1611,50 | 1611,50 | 1545,80 |
| Mar’22 | 1593,00 | 1622,00 | 1593,00 | 1620,00 | 1551,60 |
| Jun’22 | 1621,50 | 1621,50 | 1550,00 | 1552,30 | 1623,80 |
| Sep’22 | 1559,70 | 1559,70 | 1559,70 | 1559,70 | 1631,20 |
| Dec’22 | 1559,70 | 1559,70 | 1559,70 | 1559,70 | 1631,20 |
Platinum (USD/ounce)
| Period | Opening price | Expensive | Low price | Latest price | Price of the previous day |
| Dec’21 | 893,6 | 893,6 | 893,6 | 893,6 | 910,3 |
| Jan’22 | 909,1 | 915,5 | 895,6 | 911,9 | 894,2 |
| Feb’22 | 900,0 | 900,0 | 900,0 | 900,0 | 894,4 |
| Apr’22 | 903,7 | 915,4 | 899,0 | 912,0 | 894,1 |
| Jul’22 | 910,0 | 911,4 | 910,0 | 911,4 | 895,4 |
| Oct’22 | 900,0 | 912,0 | 892,0 | 897,1 | 913,9 |
| Jan’23 | 897,0 | 899,1 | 897,0 | 899,1 | 915,9 |
Bạc (USD/ounce)
| Period | Opening price | Expensive | Low price | Latest price | Price of the previous day |
| Dec’21 | 21,500 | 21,640 | 21,500 | 21,508 | 21,887 |
| Jan’22 | 22,060 | 22,075 | 21,950 | 21,950 | 21,514 |
| Feb’22 | 21,825 | 21,840 | 21,515 | 21,530 | 21,909 |
| Mar’22 | 22,070 | 22,140 | 21,930 | 22,080 | 21,545 |
| May’22 | 22,115 | 22,175 | 21,970 | 22,110 | 21,574 |
| Jul’22 | 22,180 | 22,180 | 22,140 | 22,140 | 21,605 |
| Sep’22 | 22,035 | 22,195 | 21,585 | 21,649 | 22,029 |
| Dec’22 | 22,170 | 22,170 | 22,170 | 22,170 | 22,115 |
| Jan’23 | 21,770 | 21,770 | 21,757 | 21,757 | 22,144 |
| Mar’23 | 21,823 | 21,823 | 21,823 | 21,823 | 22,210 |
| May’23 | 21,873 | 21,873 | 21,873 | 21,873 | 22,260 |
Source: Vinanet/VITIC/Tradingcharts
T&G International Joint Stock Company
Address: 352 Hue Street, Le Dai Hanh Ward, Hai Ba Trung District, Hanoi
Hotline: 0345786803
Email: hrm@tginterjsc.com
Website: http://tginternationaljsc.com


